There are numerous KPI maintenance examples and maintenance strategies that can be measured and calculated via maintenance KPI formulas. The top 11 KPIs to track will be covered in more detail in our guide to maintenance KPIs below to help you achieve your maintenance goals.
1. Machine Downtime

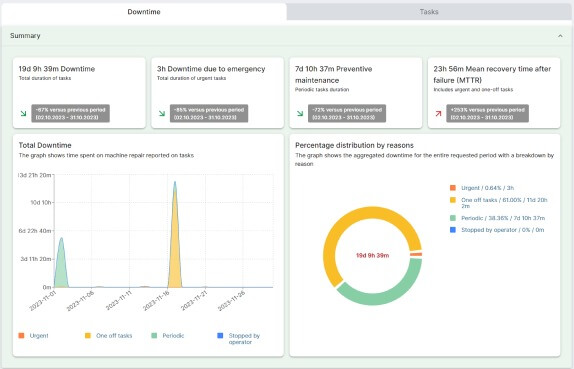
If you are wondering what key performance indicators (KPIs) for maintenance are, one of the first ones to consider is machine downtime. Also referred to as the time frame during which your equipment is out of service or isn’t working, machine downtime can sometimes be planned as part of an overall maintenance schedule.
However, more often than not, machine downtime is unplanned, resulting in stalls in production. The most important consequence of this is that costs can quickly add up. To work out the machine downtime formula, subtract the total time measured from the total hours of downtime and multiply the result by 100.
Industry benchmarks indicate that assets should run at a minimum capacity of 90%. In other words, downtime should be in the region of 10% or less. The lower the amount of downtime, the better production and manufacturing results for the organisation. Make sure the maintenance KPIs you are tracking align with your goals.
For strategies to minimise idle time and optimise machine efficiency, check out our article on idle time management.
2. Work Order Backlog
A work order or maintenance backlog is a further example of various maintenance key performance indicators. It looks at the total number of work requests that you have open in your system, ready to be worked upon. The importance of this metric is that it can help maintenance managers determine whether they have enough staff on hand to handle them all.
A leading industry benchmark is approximately two weeks' worth of work per team member. On the other hand, if you have no backlogs, it may mean you are overstaffed, while the opposite is also true. As such, work order backlogs help determine staffing requirements, too.
In addition, your teams must be proactive. This means that technicians should be able to prioritise urgent repair tasks over non-urgent ones. To make these types of “suspension” decisions, they must take into account certain criteria. Examples of these include the nature of a breakdown, technician expertise, clearance, availability and physical proximity. The calculation method for work order backlogs is as follows:
Work order backlog = Date/Time technician arrives in front of the equipment - Date/Time order issued and start of intervention
What to have a better workflow? Check out our comprehensive article on the best practices for work order management.
3. Maintenance Overtime
A further preventive maintenance KPI refers to maintenance overtime. Measured in hours, overtime is the amount of time spent outside traditional work hours on preventive or corrective maintenance tasks as they deal with emergencies or other aspects of work orders. Total maintenance hours should be kept to a minimum as industry best practice.
Maintenance overtime is considered a good benchmark to determine if there is an overreliance on reactive maintenance. If this is the case, potential consequences could include technician burnout, high maintenance costs, costly downtime and lower levels of productivity.
4. Maintenance Cost Variance
All maintenance activities have an associated cost. In an ideal scenario, these costs would be as low as possible. However, maintenance managers often find themselves over budget due to incorrectly calculated maintenance variance costs.
In essence, these costs, or this maintenance metric, consider how much was allocated to a maintenance task in terms of a formal budget (for aspects such as labour, spare parts, consumables, etc.) and the amount by which this cost was exceeded. As such, the formula for calculating this benchmark looks at subtracting the actual cost of maintenance from the expected cost of maintenance.
In reality, the result of this calculation is often negative, meaning that a maintenance job has gone over budget. Ideally, it should be either positive or zero. If positive, it means that there are more funds in the budget than planned. This can help maintenance managers keep preventive maintenance costs down. It’s an effective way of measuring the quality of one’s budget.
5. Mean Time Between Failure (MTBF)
The mean time between failure (MTBF) performance indicator is a measurement of time. It looks at the duration for which machinery and assets are not operational. The purpose of such maintenance performance metrics is to track and measure events or failures that are unplanned. This benchmark is typically evaluated over a long period of time such as a year.
MTBF is calculated by dividing the number of failures of an asset within a time frame by the total uptime of this asset. In practice, if a machine has 1,000 production hours within a year and experiences 10 failures during this time, its MTBF would be 100 hours. Although there are no industry benchmarks for what constitutes a good MTBF amount, aiming as high as possible is ideal.
Through the right maintenance management software, MTBF trends can be easily visualised. Monitoring this KPI can help maintenance teams determine if their operations require reevaluation for further streamlining. The reason why this metric is important is that it can help maintenance personnel determine how reliable their equipment is and reinforce preventive actions.
Furthermore, it can assist with improving the quality of repairs and indicate if equipment needs to be replaced. If there are breakdowns that occur frequently, this means repeated shutdowns. Consequently, this results in performance and productivity losses.
6. Mean Time to Repair (MTR)
The mean time to repair (MTR) industry benchmark considers the average amount of time that maintenance crews spend on preventive maintenance of machinery and assets. The calculation includes repair time, time spent delegating tasks, failure diagnosis, creating a maintenance plan, and others.
This total maintenance time spent on repairs divided by the total number of repairs done gives the MTR figure. An example of this calculation could look as follows: say an organisation spends a total of 40 hours on unplanned maintenance for an asset that has broken down seven times during a year. The MTR would be 5.7 hours.
In terms of industry best practices, the ideal is to keep the MTR below five. The purpose of this maintenance benchmark is to offer insights into how your organisation should respond to planned and unplanned equipment failures. It is also useful as proof of how long production was interrupted and the average time taken to repair the components.
7. Overall Equipment Effectiveness (OEE)
The оverall еquipment еffectiveness (OEE) standard considers a production plant or manufacturing facility’s overall asset performance. It looks at three critical factors. These are equipment availability, overall equipment performance and the quality of the final product.
Regarding equipment availability, the benchmark looks at whether the entire system is functioning as it should. Equipment performance divides the system’s throughput by its maximum throughput. Finally, the quality metric calculates the total number of quality units divided by the total number of product units manufactured. This formula is calculated as follows:
Availability = Run Time/Planned Production Time
Performance = (Ideal Cycle Time × Total Count)/Run Time
Quality = Quality Product Count/Total Product Count
Therefore,
OEE = Availability x Performance x Quality
OEE is highly useful in monitoring the manufacturing process’s efficiency. It can also highlight areas that need improvement.
8. Planned Maintenance Percentage (PMP)
The planned maintenance percentage (PMP) is a further important addition to a maintenance crew’s maintenance KPI metrics. Calculated as a percentage, the benchmark looks at hours spent on planned maintenance versus the number of hours spent on unplanned maintenance.
The ideal planned maintenance percentage result should be around 90%. However, an 80:20 ratio of planned to unplanned maintenance can still be considered acceptable.
9. Preventive Maintenance Compliance
Preventive maintenance (PM) compliance, or maintenance compliance, is ex ressed as a percentage of scheduled preventive work orders completed within a predefined time period. Looking at this KPI can help organisations gain a better understanding of the effectiveness of a PM programme.
Worldwide industry standards point to 90% or more as a good benchmark for schedule compliance. In practice, this means that PM tasks should be completed within 10% of the scheduled maintenance interval. As for monthly PM tasks, these should be completed within three days of the due date.
10. Completed Work Orders
Maintenance benchmarks would not be complete without studying and calculating the number of completed work orders as part of common maintenance tasks. The number of these work orders must have been completed in a given amount of time. Generally, they are measured on a daily basis. Most CMMS help maintenance managers arrive at this calculation in seconds.
11. Average Days to Complete Work Orders
This maintenance standard commences from the moment a maintenance request is filed and ends once the issue has been resolved. It offers a broad picture of your team’s functionality and the complexity of different maintenance issues.
You may think that a short routine maintenance task's time is good, but you have to balance this out with your technicians. Sometimes, a fast job means it is not carried out properly for the sake of compromising quality for speed. That’s why you should consider each work order and the amount of time taken in conjunction with the quality of the maintenance work.


