With multiple categories of CMMS reports and dashboards, we will now delve into various CMMS report examples from Fabrico’s maintenance management software. This will help you determine which ones are the perfect fit for your organisation’s needs and how they can help you achieve your production, maintenance and repair goals.
1. Total downtime
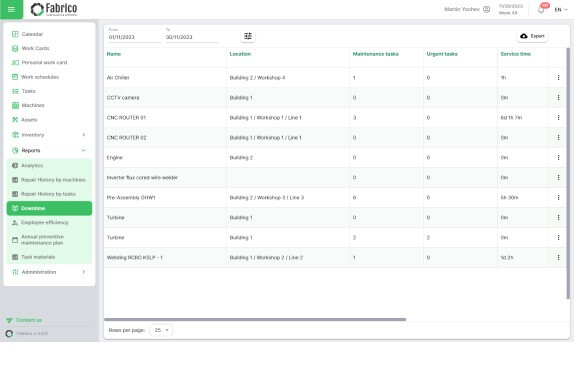
Manufacturing plants or factories use machinery to strengthen their production processes. However, these machines are expensive assets. Whenever one of them breaks down, it leads to costly unplanned downtime. When this information is collated across all the machines over a given period, say one month, a six-month period or a year, this yields a total downtime report.
When a maintenance department is aware of these hours, they can take more effective actions to improve downtime metrics through preventive and planned maintenance efforts. In particular, preventive maintenance can be scheduled in advance or during off-peak production hours. The reason behind this is to ensure a smooth operation flow by maintaining asset longevity and allowing machines to work as optimally as possible.
2. Downtime distribution by reasons
A data visualisation graph from a CMMS maintenance programme can also depict the aggregated downtime for a specific requested period with a breakdown by reason. For example, a facility manager can see urgent tasks, the percentage of work that has been completed and the amount of time spent on such tasks.
It’s also possible to view one-off tasks with their percentage of completion and time spent. The same is true for periodic tasks and tasks stopped by an operator. Such a visualisation is an excellent way to view the reasons why downtime has occurred. This can help teams manage maintenance tasks better in the future.
3. Machines with the highest total downtime
Using colours, bar charts and tables to help maintenance crews manage their downtime, another important CMMS system report example deals with machines with the highest total downtime. These are assets that have encountered the highest volume of downtime during a selected period.
In addition to the machine name and the time frame, it’s also possible to see urgent, one-off, periodic and tasks stopped by an operator. Furthermore, maintenance managers can immediately view machine stops, their locations, their total downtime, the number of stops and the average duration of stops for the halted machine. Therefore, they can help streamline and improve facility management.
4. Repair history by machines
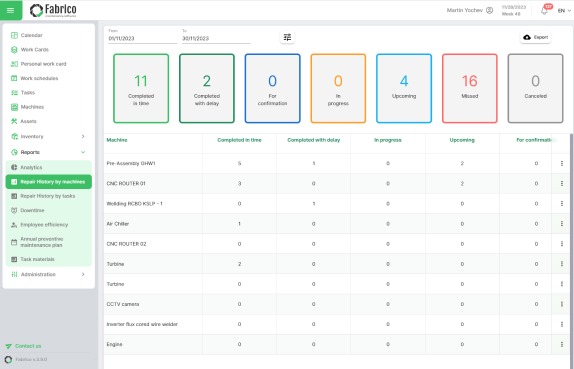
CMMS data gives you insights into the repair history of machines, which is data that provides information about a machine’s repair history. When logged into your analytics dashboard for this report, you can begin by filtering certain criteria, such as the time frame, status, task type, location and machine.
Moreover, you can export files and get an immediate overview of machine tasks completed in time, completed with delay, in progress, upcoming, for confirmation, missed and cancelled. Each of these criteria can be filtered even further by clicking on the more information button, which gives greater details about:
- The machine number
- Date
- First date
- Task
- Machine
- Status
- Last modified time
- Last modified by
- Performed by
- Confirmed by
5. Repair history by tasks
A further option to monitor your asset maintenance activities and maintenance lifecycle is to check the repair history by task when you use CMMS. You can do an individual search for a particular asset, all assets or a group of assets.
Furthermore, this type of report can help teams filter events by dates for old and updated repair work on various pieces of equipment.
The beauty of these reports is that they also enable teams to view essential information, including:
- The status of a task and which group of assets it belongs to
- The name of the activity that has been carried out
- Whether it’s a one-off or periodic type of task
- The name of the machine, the machine code and the location
- Schedule for date, complete date and date of completion
- Performer role, performer and who the order was confirmed by.
These menus and column headings are adjustable and they can be sorted in order of priority, date and other criteria mentioned here.
6. Employee efficiency
With Fabrico’s employee efficiency reports, you can view the productivity levels of each employee, irrespective of their role or location. You can also filter tasks and employees' responsibilities in terms of date.
Other criteria that you can look at include the following:
- A grid or table overview of each employee and their name
- The number of tasks they have started
- The number of tasks they have completed
- The average reaction time
- The average duration of urgent tasks
- The average duration of all tasks
When clicking the “see more” button next to each employee's name, you can go even further in depth and see which tasks they have worked on. Examples of criteria you can look at are the status, number, date, first date, name of the work order, machine, estimated duration, reported duration and total reaction time.
However, every task that an individual employee has performed can be broken down further. With Fabrico’s CMMS, it’s possible to click on “view” to get the task number, the date on which the work was performed and how long it took. You can also understand who the employee is and what they did, including a task description and submitting any attached files.
Find out more about work order management best practices to enhance your operational efficiency.
7. Annual preventive maintenance plan
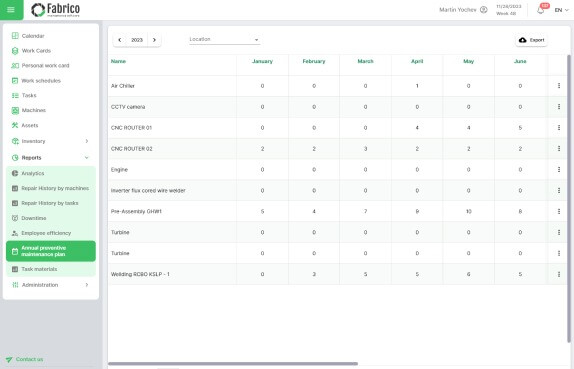
If you are looking for a monthly breakdown of the number of maintenance tasks that were carried out over a period of one year, Fabrico’s CMMS solutions offer access to this information, too.
When you click on the “see more” button next to each line item that sets out the machine in question, you can see its status, number, date, first date, task name, machine name, estimated duration of the task, reported duration and total reaction time. Furthermore, each machine can be viewed in more detail when you click on the “view” button next to it.
This will open a new window that gives you access to information such as the task number, the first planned date, whether it’s a periodic or one-off task and whether it was missed or not. You’ll also be able to see who created the task, where the location of the asset is, the estimated duration, the reported duration, when it was scheduled for and the machine in question.
Finally, the operator can add a task description and any necessary files to the task to help future operators get a better understanding of the work that was performed. It is possible to provide the checklist that was followed as well as notes that may be necessary to explain any of the work that was done. What's more is that this makes work order completion much more informed and detailed.
8. Task materials
Spare parts and inventory management is made even more streamlined and affordable with Fabrico’s CMMS maintenance software task material reports. With this reporting feature, you can do a search for company assets and filter by date.
The information and visibility are provided in a table format, which you can click and configure, and with multiple tabs. It enables you to see the status, task number, task name, whether it’s a one-off or urgent task, location, machine, machine code, spare parts price and the spare parts used.
This table can easily be exported for various decision-making and record-keeping purposes.
For example, an engine in building two required a one-off solution using three ring М12 spare parts. Once again, the columns are sortable and they can present the information you need from last to most recent or vice versa.
In one of our blog articles, you can explore more about manufacturing inventory management software.


